NinjaTrader Indicators
Momentum Multicolor Line and Bars
Detect Trend Weakness and Reversal Points!
Buy Now!The standard momentum technical analysis indicator measures the rate of change in closing prices and is used to detect trend weakness and likely reversal points.
The standard momentum technical analysis indicator measures the rate of change in closing prices and is used to detect trend weakness and likely reversal points. It is often overlooked because of its simplicity. This is a mistake because it is one of the best day trading indicators in existence.
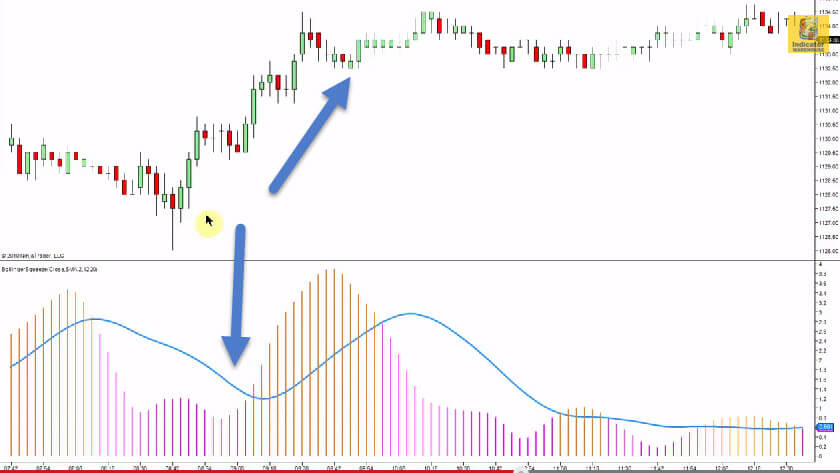
Our Momentum Multicolor Line and Bars measure the amount that an instrument’s price has changed over a given time span and expresses it as a red-green oscillating line or paint bar tool.
There are two ways to use the Momentum Multicolor Line and Bars indicator:
1. You can use the Momentum Multicolor Line and Bars indicator as a trend-following oscillator similar to the Moving Average Convergence/Divergence (MACD). Buy when the indicator bottoms and turns up and sell when the indicator peaks and turns down.
2. You can also use the Momentum Multicolor Line and Bars indicator as a leading indicator. This method assumes that market tops are typically identified by a rapid price increase (when everyone expects prices to go higher), and that market bottoms usually end with rapid price declines (when everyone wants to get out).
As a market peaks, the Momentum Multicolor Line and Bars indicator will climb sharply and then fall off — diverging from the continued upward or sideways movement of the price. Similarly, at a market bottom, Momentum will drop dramatically and then begin to climb well ahead of prices. Both of these situations result in divergences between the indicator and price.
- Indicator visualizes when the Momentum oscillator changes condition. This works very nicely in conjunction with trend based indicators.
- A leading indicator measuring an instrument’s rate-of-change
- Ongoing plot forms an oscillator that moves above and below 100.
- Indicator will also paint the candlestick bars according to momentum change.
- You can choose if the color change is expressed from one of two conditions:
- One color when line is above the Zero line and one color when line is below the Zero line.
- One color for upward line movement and one color for a downward movement.
Key Features
- NOTE: This indicator has a sophisticated plotting method that eliminates the typical “mis-paint” problem associated with NT multicolor lines. The plotting of trend changes is guaranteed accurate regardless of what CalculateOnBarClose is set to (true or false).
If you do not receive your Download Instructions email after purchasing, please be sure to double check your spam folder, and also add @indicatorwarehouse.com to your safe senders list.