Day Trading Tips and Tricks
Volume Pressure NinjaTrader indicator
 Of all the NinjaTrader indicators we have seen, this is the best at demonstrating how the existing day’s volume bars are comparing to the same bars from recent times. There aren’t many inputs to this trading tool. It only works on intraday charts.
The period of time for averaging is depending on how you set for the chart. The minimum supported is five minute bars. If you put up a five days, 5-min chart, you will get the average volume for each bar over the past a few days ( ignores today ). A twenty day, fifteen minute chart will give the average volume of each particular fifteen min bar during the past nineteen days. Hopefully that appears sensible ; just put up as many days of info as you need averaged. ( In fact, these studies are plotting average volume by bar.
But if you plot them on a time-based chart, say 5-min, then you’re seeing average volume by 5-min period of time. Due to this, if you put it on a tick chart, the time linkage is gone.
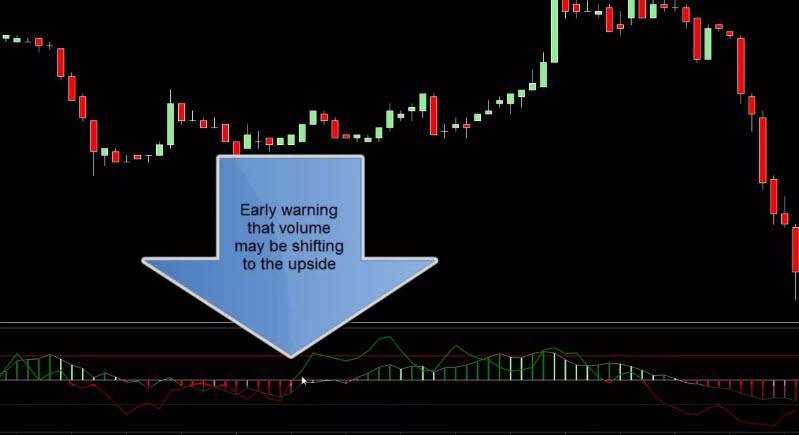
Large institutional Money creates significant Surges in market volume when it enters and when it exits. Such Surges indicate that big money is making a move, and much larger than normal numbers of shares are changing hands. (Volume Indicators). This indicator tracks big money – particularly pays attention to Volume averaging. Observation of volume times will assist in identifying price Reversals.
At any given time during a day, the NinjaTrader Volume Pressure indicator will compare the current bar’s volume to that of several previous days volume at the same time.