Day Trading Tips and Tricks
Moon Phases NinjaTrader Indicator
“In an experiment conducted on an arbitrary set of commodities for the year 1972 (Todd Lofton, July 1974, writes about his observations) it was shown that short-term movements of prices react with some uniformity with respect to the phases of the moon. In fact, the commodities chosen for observation–silver, wheat, cattle, cocoa, and sugar–showed an uncanny ability to form a rising market following a full moon and a falling market after a new moon.” -Commodity Trading Systems and Methods, P.J. Kaufman, p. 205.
Many traders believe there is a direct correlation between the primary phases of the moon and the points at which any given, freely-traded market will reverse direction. To say the least, this phenomenon is quite amazing and has nothing to do with astrology and everything to do with astronomy and physics.
The cycle of the moon from new moon to new moon is called the synodic cycle. It is 29.5 days in length. This cycle, although invisible, appears to have quite an effect on the markets.
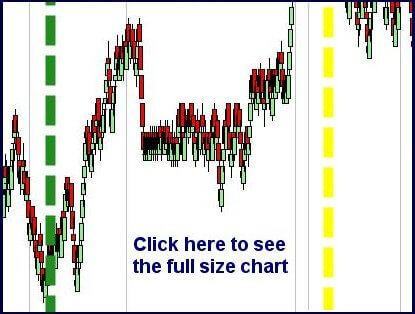
The Moon Phase indicator draws a vertical line at each bar that most closely matches the date/time of each full moon, new moon, first quarter moon, and last quarter moon between Jan 1, 2005 and Dec 31, 2015. It comes with a free data file containing the time (down to the minute) of each full moon, new moon, first quarter moon, and last quarter moon between Jan 1, 2005 and Dec 31, 2015.


