Day Trading Tips and Tricks
Uranium Back on the Radar
Law of Supply & Demand
I spent the better part of the weekend reviewing the uranium sector. This sector continues to probe the bottom, while the nuclear energy argument has begun to shift with more anti-nuke environmentalists transforming into believers of the benefits of nuclear power.

Nuclear power has suffered a massive blow as a result of the Fukushima meltdown in Japan. In a country that was dependent on receiving over 50% of its electricity from its massive infrastructure of 54 plants. Currently only two out of the 54 nuclear power plants remains on line. Since Japan is basically a resource poor nation it depends on energy imports and the high cost of fuel imports will make it more difficult for Japan to achieve and maintain a 2% inflation rate.
The cost of producing energy shows that the most cost effective is nuclear, with solar being the most expensive. When looked at in percentage of electricity produced relative to the plant capacity nuclear again leads as nuclear plants have a capacity of 90% compared to 73% for coal; 38% for natural gas; 30% for oil, 29% for hydro; 27% for wind, and 19% for solar.
The argument for nuclear energy has several new converts with many environmentalists swinging in favor. Here’s a main reasons why – for every pound of uranium used to generate energy instead of coal drops carbon emissions by 45,000 pounds. Here’s another way of looking at it – a mid-sized car produces about 5 metric tons of carbon emissions a year, so every pound of uranium over coal used drops carbon emissions equivalent to that of 4 to 5 cars.
Consider also, that current demand for uranium to power operating nuclear power plants is approximately 177 million lbs. a year. If all nuclear power plants were to be shut down and replaced by plants the burn coal the carbon emissions added would be equivalent to putting over 700 million cars on the global roads. Is it any wonder why more attention is being paid to uranium and public opinion is being turned more positive towards nuclear power.
On a global scale demand for uranium continues to grow. Here’s a news flash – don’t be fooled by the mumbo – jumbo coming out of Germany and Switzerland regarding the phasing out of nuclear power via reactor shut downs. Both countries are now in the financing game of – you guessed it nuclear plants located outside of national jurisdictions. Much of Germany’s electricity is wired from one of France’s nuclear power plants. Germany can continue doing this at the moment even at inflated prices, but ultimately the powers that be will realize the necessity to keep energy demands filled by cheaper national supply.
The caveat in the supply & demand equation is China. China remains in the process of improving existing and building new infrastructure, which tends to skew commodity demand numbers to the high side. The caveat here can be narrowed to the central bank of China and its determination and willingness to continue to finance projects. Presently, China remains firm in reaching its goal to quadruple the countries nuclear capacity by 2020 through the operations of the 26 reactors under construction, which is on track to fulfill the 2050 goal of ramping up to 400 gigawatt.
Now here’s the kicker caveat in order to fuel that kind of demand, China will require 195 million pounds of uranium on an annual basis. That is more uranium than the entire planet currently consumes. I see a nasty ride on the supply & demand roller coaster.
According to the World Nuclear Association there are 433 operational reactors worldwide – the United States leads the pack with 104 reactors. As of 2011 the U.S. uses 51 million lbs. of uranium to produce 20% of its national electric energy. As the global leader in uranium energy supply the U.S. produces less than 4.5 million pounds of uranium annually. This puts the United States firmly in the “demand” column as import markets begin to head higher. When compared to oil imports, the U.S. has a greater dependency on foreign uranium supplies than oil.
Now, for the mother of all caveats – who controls the energy? If you have anything to do with “D.C. Beltway” you will totally get this – the oil imported by the U.S. is primarily from “friendly sources.”
Uranium on the other hand does not share the same “favored nation” status. Russia has quickly become the global player within the uranium supply chain and has been on a global buying spree taking advantage of rock bottom uranium prices and clearly has taken the lead in global acquisitions of uranium supply. As of 2013 over 40% of United States uranium imports come from Russia or countries influenced by Russia.
Ah, the smell of politics first thing in the morning! It can really upset many sectors.
Ok, the picture may be a bit murky as the hate flag continues to wave high above the uranium sector, but the trade set-ups are beginning to favor attention. There are ETFs, Funds, and options that trade – the key take away remains finding the market that has the greatest volume. At the moment what is available leans more to longer duration position trading using options. If the markets draw some attention things could be more interesting for shorter durational trades as well.
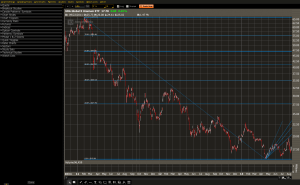
This chart is the 5 year daily of URA – (Global X Uranium ETF) and the pattern left in place off of the April lows suggests or leaves open the potential for a retest if not new 52 week lows. The Fibonacci Fan off of the April bottom reveals pockets of resistance the market will have to sail through if the low is to remain in place with a rally up into the Fibonacci resistance levels underway. More importantly for me as a take away – whether uranium retests or moves to new lows the longer term path of least resistance will be up.