Day Trading Stocks Using Technical Analysis Indicators
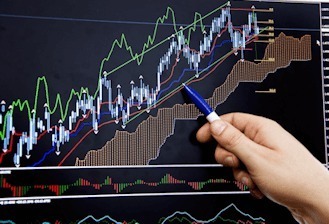
In essence, the main goal of technical analysis is the focus on price movement. A chart will show you movement (or no movement) and when the market is trending. It also shows you the strength of the trend. By adding volume, momentum and oscillators, you will see a clear picture of all the action happening with that stock, in the market. With this method you can take in a lot of knowledge with just a simple glance. Technicians use this tool as a way to analyze the stock without using economic reports (a method so often cherished by fundamentalist).
The details of technical analysis allow you to view moving averages by watching the price moving in a trend or void of any movement. You will be able to see that it is moving sideways, up or down, and for how long in any direction. The quickly identifiable patterns are often used as a measurement to predict future movement. You can immediately see ascending and descending triangles, rounded bottoms and tops, head and shoulder patterns, etc., which are often difficult if not impossible to detect unless it is displayed on a chart.
With the instant availability of gathering charts over the internet, traders now have access to a variety of technical analysis indicators to help generate more profits. The best technical indicators provide analysis that is much quicker and less costly than performing any type of fundamental analysis.
Although charts do not use information gleaned from an extensive economic report on a specific stock they do display a detailed story concerning its price movement. Whether the movement of the stock is complex, simple or complicated, a chart can quickly reveal the different twists and turns of its movements, to reveal any trend, resistance or support. Charting helps the day trader analyze the trend to reveal how the momentum of the stock is building and whether critical formations have begun to develop, which might be used to create profits in the trade.
