“Fantastic for Identifying Opening Support and Resistance Levels…”
Buy Now!Initial Balance Lines were first introduced into the trading community by J. Peter Steidlmayer, the original developer of the Market Profile® along with the Chicago Board of Trade in the mid to late 1980s. Initial balance was defined as the price range resulting from market activity during the first two thirty minute time periods.
James Dalton expanded on the Initial Balance concept by identifying it as a valuable tool for identifying the high and low often made in the first 90 minutes of trading after the Open. Initial Balance Lines helps you visualize possible trading scenarios and formulate the most appropriate trade strategy and tactics for the rest of the day.
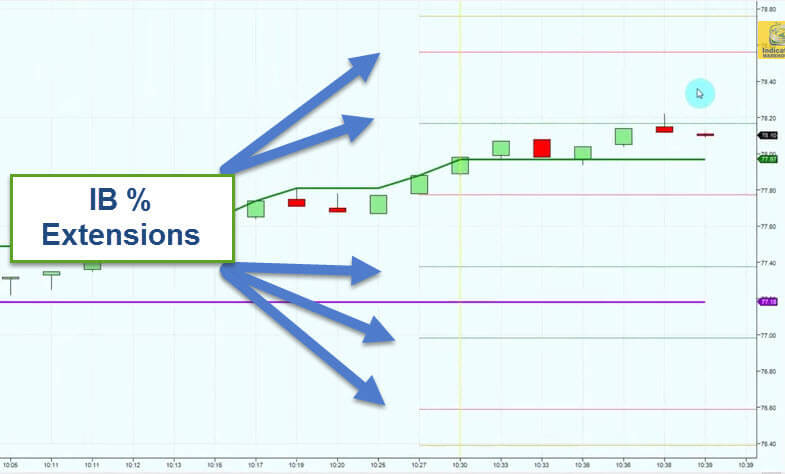
Initial Balance Lines with Range Extensions enables you to recognize the range of initial trading balance, its base, and the percentage extensions outside the balance area. This, in turn will help you visualize possible trading scenarios, gauge your expectations, and guide your trading as the day plays out.
- Plots the Initial Balance (IB) and 25% extensions from the IB.
- Key Features/Parameters: User can set number of minutes after Open to define IB
- User can set the Start Time used to define IB
Note: Intra-day charts only
If you do not receive your Download Instructions email after purchasing, please be sure to double check your spam folder, and also add @indicatorwarehouse.com to your safe senders list.
