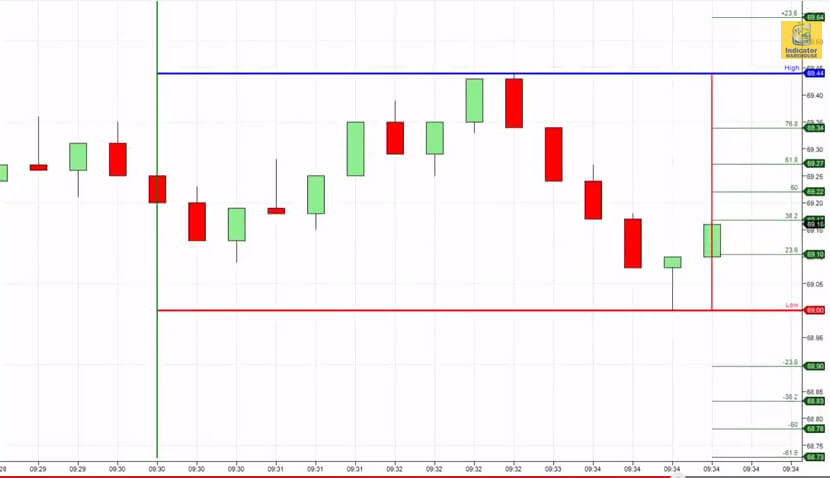
Fast and Easy Fib Analysis
Buy Now!Massive Time Saver for Dynamically Drawing
Fibonacci Support and Resistance Lines
- Enter up to 10 Fibonacci percentages (like 0.5, 0.618, 1.618, 5.618, etc).
- The Fibonacci percentages below 1.0 (like 0.618) will be drawn between the High and Low levels.
- The Fibonacci percentages above 1.0 (like 1.618, 2.75, etc) will be drawn both above the High and below the Low. This is a huge improvement to the indicator…much more flexible.
- Takes a user defined start time and session length and calculates the high and low range of that period of time on each day, and then calculates several key Fibonacci retracement and extension levels from that high and low.
- As you scroll back the chart, the indicator dynamically finds the most recent session (high and low) and draws the Fibonacci levels that were in play at that particular time.
- Great for historical analysis
If you do not receive your Download Instructions email after purchasing, please be sure to double check your spam folder, and also add @indicatorwarehouse.com to your safe senders list.
