Road Runner Trading System

Simple, Easy, and Accurate.
The Road Runner Forex and futures Trading System is SIMPLE and EASY to use right out of the box. It comes with fast ACCURATE audio and visual signals, and best of all it works with the FREE Direct Edition of NinjaTrader (Versions 7 & 8) and is Priced for FX Traders.
$495 (Lifetime license – No Additional Fess!)

The Road Runner Forex and Futures Trading System for NinjaTrader 7/8 is designed for use on the NinjaTrader trading platform and can be used with the free version of NinjaTrader.
Any Market, Any Time
Trade Futures, Forex, and Stocks with Raptor. Early warning trade alerts enable you monitor and trade dozens of markets simultaneously.

Ease of Use
Easy to read charts, clear “trade now” signals and stress-free trade management enable confident trading.

New Upgrades for FREE
You will receive all new versions or upgrades to any of the Indicator Software you own, FREE of charge, forever.
Limited Time Offer! Check out the RoadRunner Coyote Pack that includes recommended tools for your success!
RR Lines (Road Runner Macro/Micro Lines)
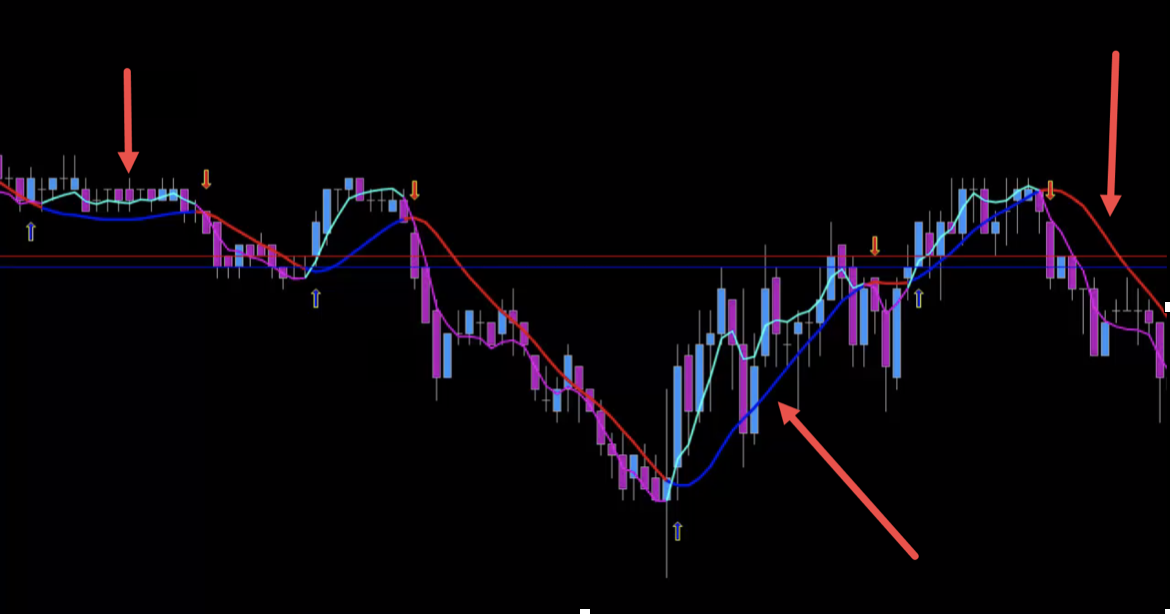
The Road Runner trading system produces Buy and Sell signals using customized trend lines. We call the thick line the Macro-Line and the thin line the Micro-Line. Signal bars form when the Macro and Micro lines cross. These give you your cues to Buy and Sell. When a signal bar forms, the Road Runner will give you an audio alert as well as printing an arrow on the chart, so you’ll never miss a trade! A trade initiates when the next bar trades above the high of the signal bar or, in the case of a Sell signal, when the next bar trades below the low of the signal bar.
RR Filter (Road Runner Filter)
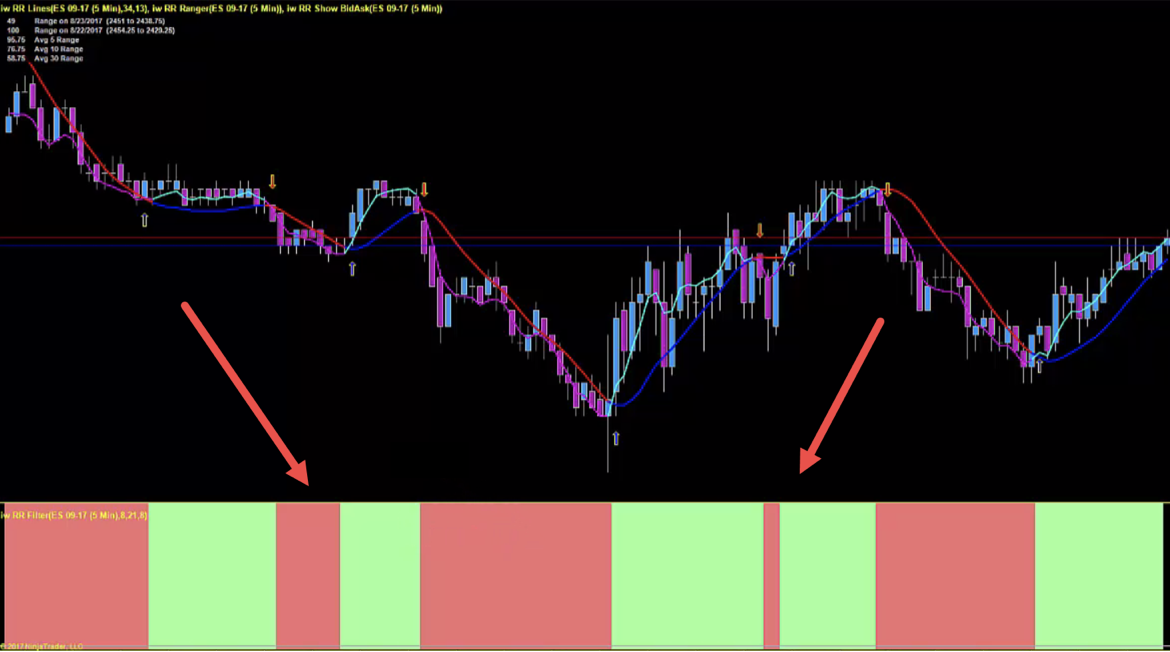
The Road Runner also has a specialized filter at the bottom of the chart called the RR Filter. You use this filter in a couple of ways. First, the RR Filter can be used to confirm Buy and Sell signals on the chart. What you’re looking for is confluence. In other words, if the Road Runner prints a Buy signal, you want to see a green filter. This condition confirms there is enough bullish momentum to take the trade.
The RR Filter can also be used to gauge the market’s energy and help you spot early shifts in momentum. For example, when large green blocks, which signify bullish momentum, start to break up and begin producing larger red blocks, this suggests the Buyers are losing their grip on the market and Sellers are getting stronger. If you’re a trader who likes to try to run out a position as far as possible, the RR Filter will help you decide when a trend change is coming and when it’s time to bring your stops in a little tighter and maybe even set a profit target for your trade.
RR Spread (Road Runner Spread Lines)
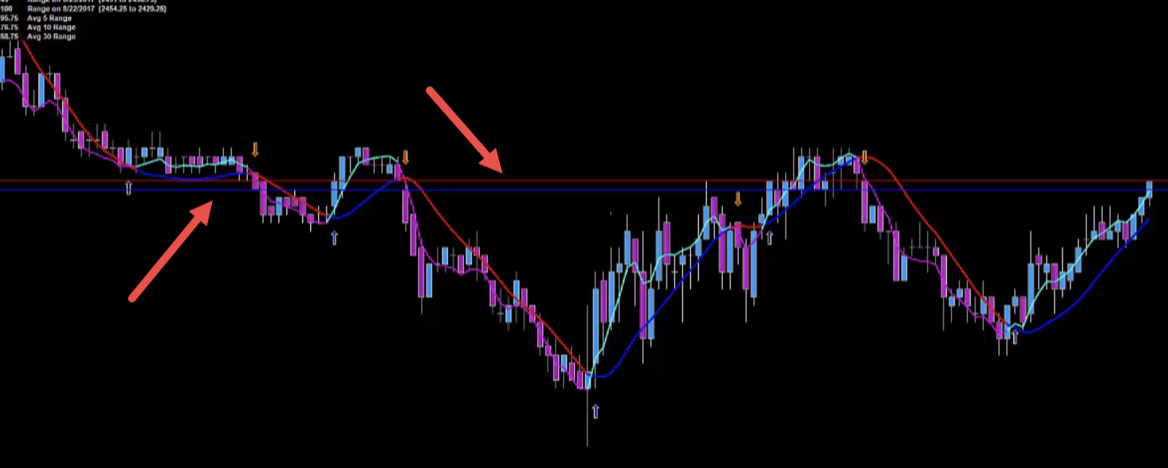
The Road Runner Forex Trading System also has bid and ask lines, which show you the market spread. These are particularly useful for trading the Forex markets, as the bid and ask lines to give you a clear visual of the current spread in the market. As a rule of thumb, the larger the spread, the more volatile the market is becoming.
RR Ranger (Road Runner Ranger)
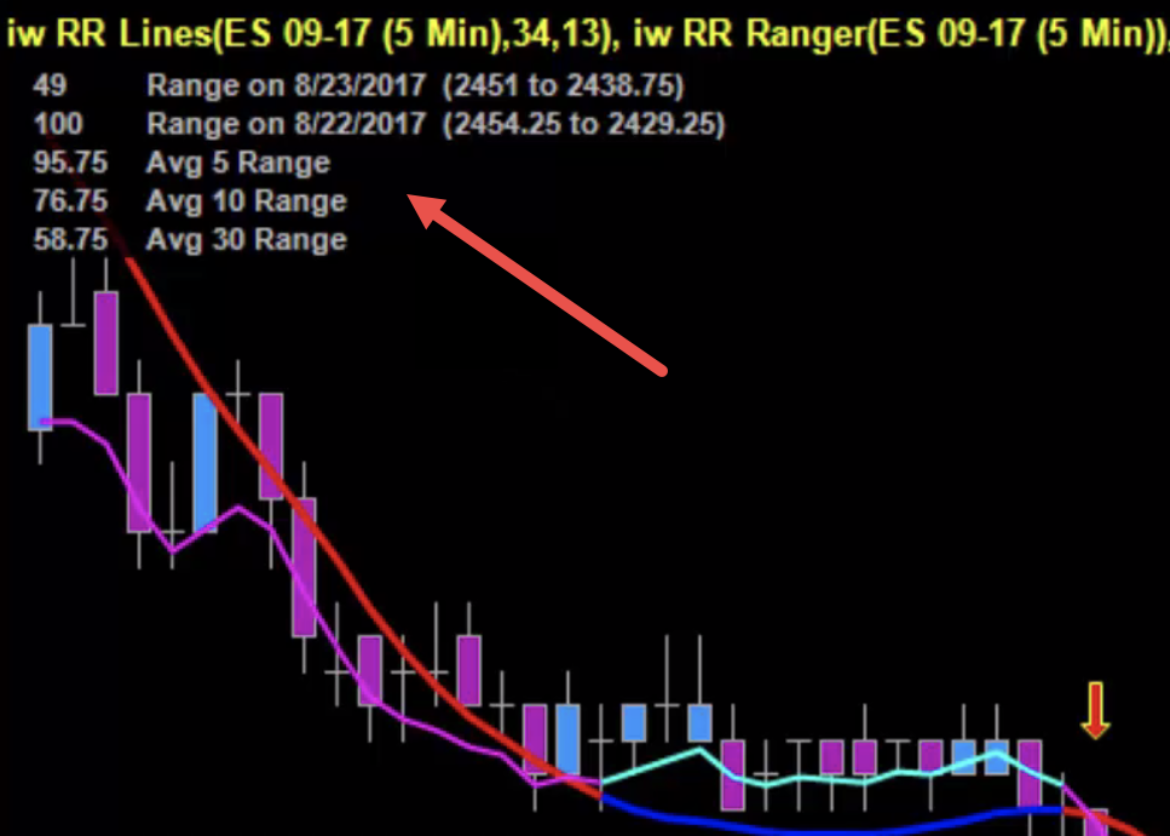
RR Ranger displayed in the top left corner of the chart is helpful in gauging market volatility and how far the market might go. The RR Ranger gives you a breakdown of the daily trading range as well as yesterday’s trading range and the 5, 10, and 30-day ranges. This information gives you clues as to whether the market is expanding, making a more volatile market, or if the ranges are contracting and possibly leading to a sideways-ranging market.
The RR Ranger is also useful for setting profit and stop-loss levels. For example, let’s say you decide you’re going to try to capture 30% of the daily range as a profit objective. If the daily range is expanding, as it is here, you might choose a higher figure, let’s say 80 ticks as a possible daily range. 30% of would make your target move 24 ticks in the E-mini. Likewise, you can use the RR Ranger as a tool to decide how far back your stops need to be, based on market volatility. For example, if you use those same 80 ticks as a probable range for the day, and you decide you will risk 15% as a stop-loss, then your stop-loss order would be 12 ticks back. With the RR Ranger, you no longer guess at what your best profit targets and stop-losses should be. Now you have real, certifiable information you can use to plan your trades.
Features and Functionality
- RR Macro/Micro Lines for Buy and Sell alerts
- RR Filter for Trade Signal Confirmation
- RR Spread Lines for Forex Trading
- RR Ranger for Stop Loss and Profit Target Levels
Documentation and Support
- Versatile system runs on any NinjaTrader chart type
- Trade any Market or Instrument
- Includes complete Trading Manual
- Trade Example Videos and Setup Explanations
- Check out our Public Training Videos


